Grafana
You can send audit log notifications to Grafana as chart annotations. This Harness FME audit log webhook abridges notifications into chart annotations for Grafana. The annotations are tagged as 'split' so that a Grafana user can put an annotation query on any dashboard to see Harness FME notifications. You can read about Grafana Chart Annotations. A single node.js lambda does the work for the integration, using only the filesystem (for API keys) and the Axios HTTP client. The integration receives audit log notifications, abridges them into new annotations, and calls the Grafana annotation API to create new annotations.
Prerequisites
Before you start, you should be familiar with AWS and working with Lambdas.
Installing the Harness FME audit log webhook
The Harness FME audit log webhook is a node.js lambda, which is designed to be deployed in AWS. To install the webhook on your local environment, do the following:
-
Clone the Split Grafana repository in an empty directory.
-
In the directory, carefully copy your Grafana API key into a file called GRAFANA_API_KEY (I used admin role key).
-
Copy the host and port of your Grafana server into a file called GRAFANA_URL.
For example: http://your.grafana.host.or.ip:3000
The default port is
3000. Change this to the proper host and port of your Grafana server. The host must be accessible from AWS. Local installs won’t be visible to the integration lambda.NoteBe sure you don’t copy or add a trailing slash. If you add an extra space or trailing slash at the end of the line, or empty lines after, the key won’t be recognized and the integration fails to run correctly. In addition, the file names must precisely be the names as shown above (written in capital letters).
-
From this directory, use a terminal to do the following. If npm is not installed, you must install it:
  > npm install
  > zip -r grafana.zip *
The grafana.zip now includes the index.js, the Grafana key and url files, and a full node_modules directory.
You can also "brew install npm" on OSX. Follow the instructions to install npm for other operating systems.
Creating an annotation query for tag split
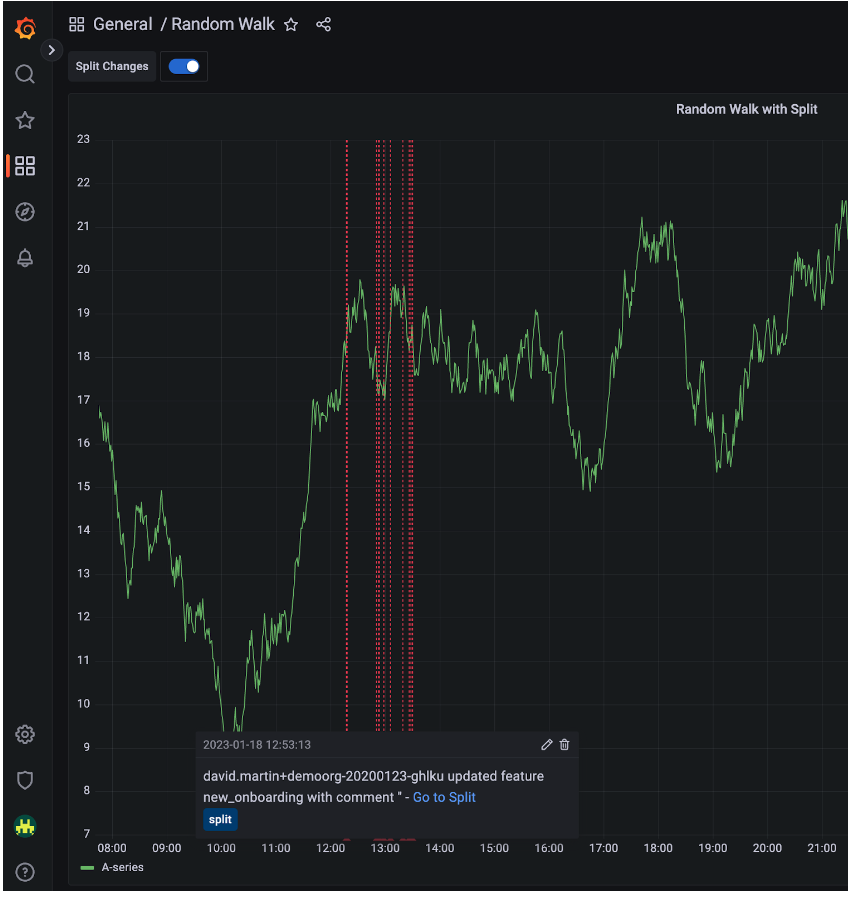
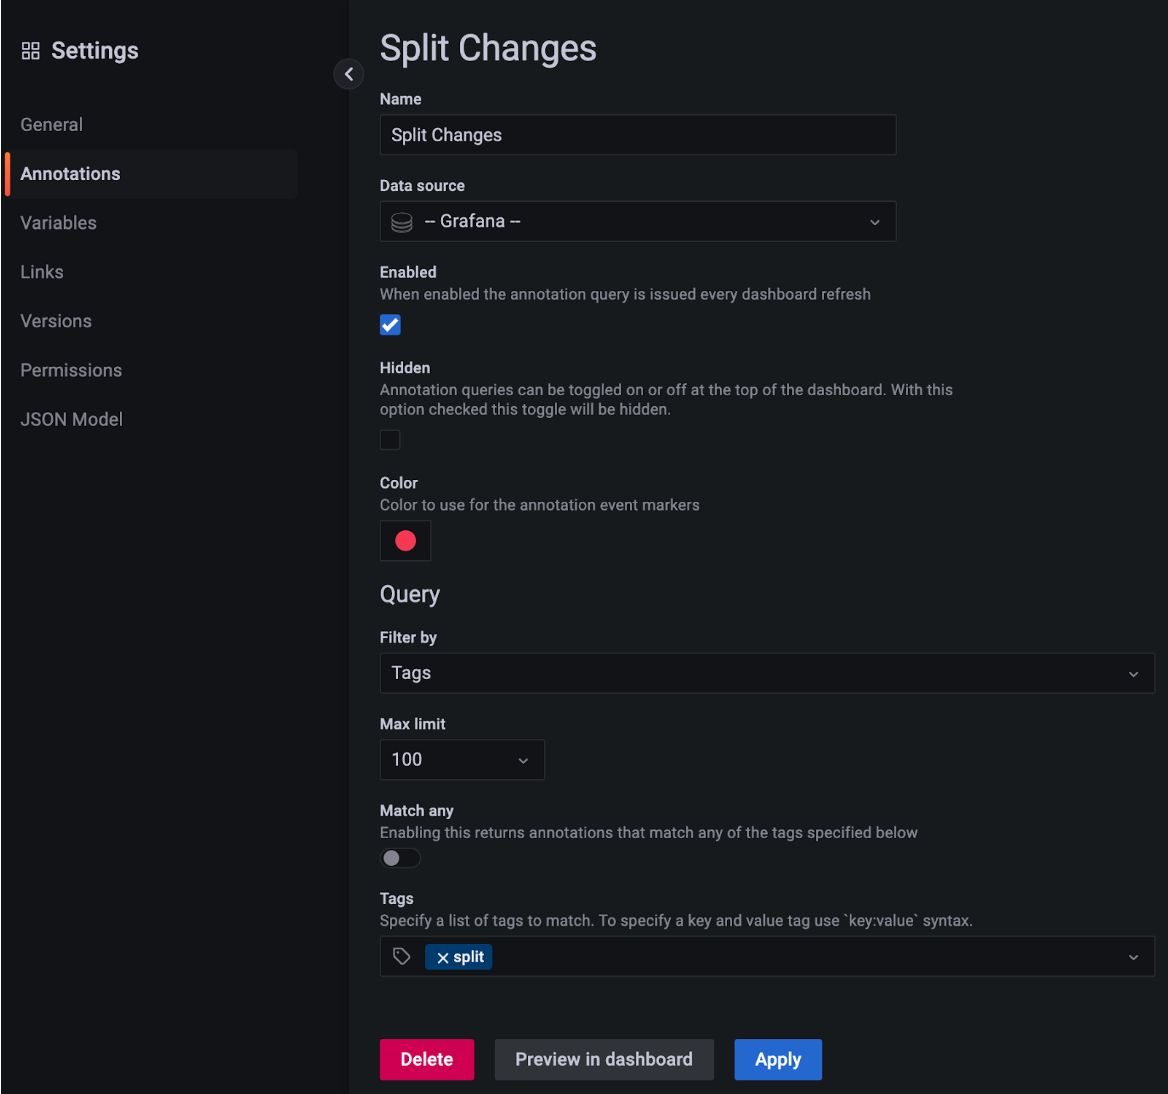
You must create an annotation query for tag 'split' on the dashboards for where you want the Harness FME annotations to appear. Refer to the Grafana documentation for information about dashboard settings. Once you set this up, you see the following:
The following shows you an example of what you see when you click the Preview in dashboard button:
Installing in AWS
To install Grafana in AWS, do the following:
- Create a new "split2grafana" lambda for Nodes.js.
- Upload grafana.zip to the Code screen of your AWS lambda.
- Once you create a lambda, create a functional URL to POST to it.
- Enable CORS and give the Allow Headers field a *
- Provide the functional URL to a new Harness FME audit log webhook.
- Use the Harness FME webhook test button to make sure you get back a 200 response from your lambda.
Debug
Use CloudWatch to look at inbound events and check they're properly handled. Incorrect key or Grafana server host and port are likely problems.
About this integration
This is a third-party integration that has been tested by the Harness FME team. Harness does not own or maintain this integration. For more information, reach out to the contributor.
We encourage contribution for all third-party integrations. You can find the repo that backs this integration which is found in GitHub. To learn more about all our integrations, check out our integrations page. If you’d like a demo of Harness FME, or help to implement any of our integrations, contact support@split.io.