Split Proxy
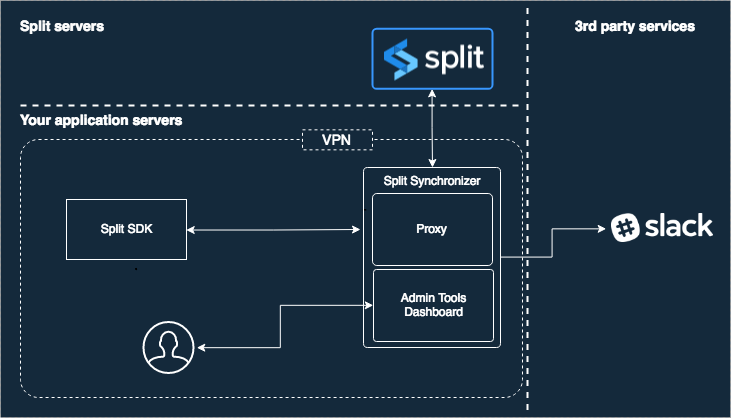
The Split Proxy enables you to deploy a service in your own infrastructure that behaves like Harness servers and is used by both server-side and client-side SDKs to synchronize the flags without connecting to Harness FME's actual backend directly.
This tool reduces connection latencies between the SDKs and Harness FME servers, and when a single connection is required from a private network to the outside for security reasons.
Architecture
Setup
Docker (recommended)
The service is available via Docker or command line, and its source code is available at the split-synchronizer GitHub site.
- Pull the image:
docker pull splitsoftware/split-proxy - Run as:
docker run --rm --name split-proxy \
 -p 3000:3000 \
 -p 3010:3010 \
 -e SPLIT_PROXY_APIKEY="your-sdk-key" \
 -e SPLIT_PROXY_CLIENT_APIKEYS="123456,qwerty" \
 splitsoftware/split-proxy
The SPLIT_PROXY_APIKEY is the server-side SDK API Key that you can find or create in Admin settings. The Split Proxy uses the SPLIT_PROXY_APIKEY to connect to Harness servers.
The SPLIT_PROXY_CLIENT_APIKEYS is a list of strings that the Split Proxy will use to authenticate a client. (A Split Proxy client is a client/server-side FME SDK instance that connects to Split Proxy.) The Split Proxy will validate the client by comparing the key the client provides with the strings listed in SPLIT_PROXY_CLIENT_APIKEYS. These keys can be any string, generated via any method of your choice. For example, you can generate a GUID or use the string "hello" (e.g. for initial setup and testing the connection). As long as the Proxy client supplies a string that is in the SPLIT_PROXY_CLIENT_APIKEYS list, the Proxy will accept the client and forward the request to Harness servers. The Split Proxy client (the client/server-side FME SDK instance) will supply a Split Proxy Client API Key in the usual place of the SDK Key.
Command line
To install and run the service from command line, depending of your platform, follow the steps below:
Linux
On Linux systems, invoke the Proxy service install script with the following:
curl -L -o install_linux.bin 'https://downloads.split.io/proxy/install_split_proxy_linux.bin' && chmod 755 install_linux.bin && ./install_linux.bin
OSX
On OSX systems, invoke the Proxy service install script with the following:
curl -L -o install_osx.bin 'https://downloads.split.io/proxy/install_split_proxy_osx.bin' && chmod 755 install_osx.bin && ./install_osx.bin
Windows
On Microsoft Windows systems, follow the steps below:
-
Download the app from https://downloads.split.io/proxy/split_proxy_windows.zip.
-
Unzip the downloaded file.
-
Run it.
The links above point to the latest version. To download a previous version of split-sync, go to https://downloads.split.io/proxy/downloads.proxy.html.
Run the service
To run the service, paste the following snippet into your command line terminal and add your SDK key.
Linux/Mac
split-proxy -apikey "your_sdk_key" -client-apikeys "your_client_key_1,your_client_key_2"
Windows
Open the cmd terminal or the PowerShell terminal, go to (cd) your unzipped Split Proxy folder, and type:
split-proxy -apikey "your_sdk_key" -client-apikeys "your_client_key_1,your_client_key_2"
Recommended configuration for production
You can run the service with the simple steps above, but the system is more stable in your production environment when you run the job with a scheduling system. We recommend starting the Proxy using supervisord, a daemon that launches other processes and ensures they stay running.
To use supervisord, make sure you install it on your machine. You can get help on the installation at the official Supervisord documentation.
After you install supervisord into your project, copy and paste the program below anywhere into the supervisord.conf file that should now be in your project.
[program:splitio_proxy]
command=/usr/local/bin/split-proxy -config /path/to/your/config.file.json
process_name = SplitIO
numprocs = 1
autostart=true
autorestart=true
user = your_user
stderr_logfile=/var/log/splitio.err.log
stderr_logfile_maxbytes = 1MB
stdout_logfile=/var/log/splitio.out.log
stdout_logfile_maxbytes = 1MB
Advanced configuration
The Proxy service has several knobs for configuring performance. Each knob is tuned to a reasonable default. However, you can override the default values by changing a splitio.config.json file or by setting your customer values as parameters of -config in the command line option. In this section, we lay out all the different knobs you can configure for performance, persistent storage, and logging.
The splitio.config.json file provided using the -config option lets you control how often the synchronizer fetches data from Harness servers. You can create a sample JSON file automatically with default values by running the following command:
./split-proxy -write-default-config "/home/someuser/splitio.config.json"
Save the JSON config file on your server in your desired folder. For example, on Linux systems, you can save it in the etc folder. Be sure to set the right path as the -config parameter.
{
  "apikey": "YOUR_SDK_KEY",
  "ipAddressEnabled": true,
  "initialization": {
    "timeoutMS": 10000,
    "snapshot": "",
    "forceFreshStartup": false
  },
  "server": {
    "apikeys": [
      "YOUR_SDK_KEY"
    ],
    "host": "0.0.0.0",
    "port": 3000,
    "httpCacheSize": 1000000
  },
  "admin": {
    "host": "0.0.0.0",
    "port": 3010,
    "username": "",
    "password": "",
    "secureChecks": false
  },
  "storage": {
    "volatile": {},
    "persistent": {
      "filename": ""
    }
  },
  "sync": {
    "splitRefreshRateMs": 60000,
    "segmentRefreshRateMs": 60000,
    "advanced": {
      "streamingEnabled": true,
      "httpTimeoutMs": 30000,
      "impressionsBufferSize": 500,
      "eventsBufferSize": 500,
      "telemetryBufferSize": 500,
      "impressionsWorkers": 10,
      "eventsWorkers": 10,
      "telemetryWorkers": 10,
      "internalTelemetryRateMs": 3600000
    }
  },
  "integrations": {
    "impressionListener": {
      "endpoint": "",
      "queueSize": 100
    },
    "slack": {
      "webhook": "",
      "channel": ""
    }
  },
  "logging": {
    "level": "info",
    "output": "stdout",
    "rotationMaxFiles": 10,
    "rotationMaxSizeKb": 0
  },
  "healthcheck": {
    "dependencies": {
      "dependenciesCheckRateMs": 3600000
    }
  }
}
All available options in the JSON file are also included as command line options. Run the command followed by the -help option to see more details, or just keep reading this documentation page.
Methods to Configure the Split Proxy
You can configure the Split Proxy using the command line or by directly editing the above mentioned JSON configuration file.
All config values are set with a default value that you can see in the example JSON file above. You can overwrite the default value from the JSON config file, and you can overwrite the JSON config file from the command line. Refer to the sample below for how to do that using the command line.
split-proxy -config "/etc/splitio.config.json" -log-level=info -admin-username="admin" -admin-password="somePass"
CLI Configuration options and its equivalents in JSON and Environment variables
The following table includes the available command line, JSON, and environment variable options and their descriptions. It specifies configuration options for the Split Synchronizer. You can configure the synchronizer using command line arguments, environment variables when you run it as a docker container, and a JSON file when you run it locally. All of these configuration options can be used regardless of the configuration method.
With the Split Synchronizer v5.0.0, the only accepted values for boolean flags are "true" and "false" in lowercase. Values such as "enabled", "on", "yes", or "True" result in an error when you start up. This applies to JSON, CLI arguments, and environment variables.
| Command line option | JSON option | Environment variable (container-only) | Description |
|---|---|---|---|
| log-level | level | SPLIT_PROXY_LOG_LEVEL | Log level (error|warning|info|debug|verbose). |
| log-output | output | SPLIT_PROXY_LOG_OUTPUT | Where to output logs (defaults to stdout). |
| log-rotation-max-files | rotationMaxFiles | SPLIT_PROXY_LOG_ROTATION_MAX_FILES | Max number of files to keep when rotating logs. |
| log-rotation-max-size-kb | rotationMaxSizeKb | SPLIT_PROXY_LOG_ROTATION_MAX_SIZE_KB | Max file size to keep before rotating log files. |
| admin-host | host | SPLIT_PROXY_ADMIN_HOST | Host where the admin server will listen. |
| admin-port | port | SPLIT_PROXY_ADMIN_PORT | Admin port where incoming connections will be accepted. |
| admin-username | username | SPLIT_PROXY_ADMIN_USERNAME | HTTP basic auth username for admin endpoints. |
| admin-password | password | SPLIT_PROXY_ADMIN_PASSWORD | HTTP basic auth password for admin endpoints. |
| admin-secure-hc | secureChecks | SPLIT_PROXY_ADMIN_SECURE_HC | Secure Healthcheck endpoints as well. |
| admin-tls-enabled | enabled | SPLIT_PROXY_ADMIN_TLS_ENABLED | Enable HTTPS on proxy endpoints. |
| admin-tls-client-validation | clientValidation | SPLIT_PROXY_ADMIN_TLS_CLIENT_VALIDATION | Enable client cert validation. |
| admin-tls-server-name | serverName | SPLIT_PROXY_ADMIN_TLS_SERVER_NAME | Server name as it appears in provided server-cert. |
| admin-tls-cert-chain-fn | certChainFn | SPLIT_PROXY_ADMIN_TLS_CERT_CHAIN_FN | X509 Server certificate chain. |
| admin-tls-private-key-fn | privateKeyFn | SPLIT_PROXY_ADMIN_TLS_PRIVATE_KEY_FN | PEM Private key file name. |
| admin-tls-client-validation-root-cert | clientValidationRootCertFn | SPLIT_PROXY_ADMIN_TLS_CLIENT_VALIDATION_ROOT_CERT. | X509 root cert for client validation |
| admin-tls-min-tls-version | minTlsVersion | SPLIT_PROXY_ADMIN_TLS_MIN_TLS_VERSION | Minimum TLS version to allow X.Y. |
| admin-tls-allowed-cipher-suites | allowedCipherSuites | SPLIT_PROXY_ADMIN_TLS_ALLOWED_CIPHER_SUITES | Comma-separated list of cipher suites to allow. |
| impression-listener-endpoint | endpoint | SPLIT_PROXY_IMPRESSION_LISTENER_ENDPOINT | HTTP endpoint to forward impressions to. |
| impression-listener-queue-size | queueSize | SPLIT_PROXY_IMPRESSION_LISTENER_QUEUE_SIZE | max number of impressions bulks to queue. |
| slack-webhook | webhook | SPLIT_PROXY_SLACK_WEBHOOK | slack webhook to post log messages. |
| slack-channel | channel | SPLIT_PROXY_SLACK_CHANNEL | slack channel to post log messages. |
| apikey | apikey | SPLIT_PROXY_APIKEY | FME server-side SDK API key. |
| ip-address-enabled | ipAddressEnabled | SPLIT_PROXY_IP_ADDRESS_ENABLED | Bundle host's ip address when sending data to Harness FME. |
| timeout-ms | timeoutMS | SPLIT_PROXY_TIMEOUT_MS | How long to wait until the synchronizer is ready. |
| snapshot | snapshot | SPLIT_PROXY_SNAPSHOT | Snapshot file to use as a starting point. |
| force-fresh-startup | forceFreshStartup | SPLIT_PROXY_FORCE_FRESH_STARTUP | Wipe storage before starting the synchronizer |
| client-apikeys | apikeys | SPLIT_PROXY_CLIENT_APIKEYS | Apikeys that clients connecting to this Proxy will use. |
| server-host | host | SPLIT_PROXY_SERVER_HOST | Host/IP to start the proxy server on. |
| server-port | port | SPLIT_PROXY_SERVER_PORT | Port to listen for incoming requests from SDKs. |
| server-tls-enabled | enabled | SPLIT_PROXY_SERVER_TLS_ENABLED | Enable HTTPS on proxy endpoints. |
| server-tls-client-validation | clientValidation | SPLIT_PROXY_SERVER_TLS_CLIENT_VALIDATION | Enable client cert validation. |
| server-tls-server-name | serverName | SPLIT_PROXY_SERVER_TLS_SERVER_NAME | Server name as it appears in provided server-cert. |
| server-tls-cert-chain-fn | certChainFn | SPLIT_PROXY_SERVER_TLS_CERT_CHAIN_FN | X509 Server certificate chain. |
| server-tls-private-key-fn | privateKeyFn | SPLIT_PROXY_SERVER_TLS_PRIVATE_KEY_FN | PEM Private key file name. |
| server-tls-client-validation-root-cert | clientValidationRootCertFn | SPLIT_PROXY_SERVER_TLS_CLIENT_VALIDATION_ROOT_CERT | X509 root cert for client validation. |
| server-tls-min-tls-version | minTlsVersion | SPLIT_PROXY_SERVER_TLS_MIN_TLS_VERSION | Minimum TLS version to allow X.Y. |
| server-tls-allowed-cipher-suites | allowedCipherSuites | SPLIT_PROXY_SERVER_TLS_ALLOWED_CIPHER_SUITES | Comma-separated list of cipher suites to allow. |
| http-cache-size | httpCacheSize | SPLIT_PROXY_HTTP_CACHE_SIZE | How many responses to cache. |
| persistent-storage-fn | filename | SPLIT_PROXY_PERSISTENT_STORAGE_FN | Where to store flags and user-generated data. (Default: temporary file). |
| split-refresh-rate-ms | splitRefreshRateMs | SPLIT_PROXY_SPLIT_REFRESH_RATE_MS | How often to refresh feature flags. |
| segment-refresh-rate-ms | segmentRefreshRateMs | SPLIT_PROXY_SEGMENT_REFRESH_RATE_MS | How often to refresh segments. |
| streaming-enabled | streamingEnabled | SPLIT_PROXY_STREAMING_ENABLED | Enable/disable streaming functionality. |
| http-timeout-ms | httpTimeoutMs | SPLIT_PROXY_HTTP_TIMEOUT_MS | Total http request timeout. |
| impressions-workers | impressionsWorkers | SPLIT_PROXY_IMPRESSIONS_WORKERS | #workers to forward impressions to Harness servers. |
| events-workers | eventsWorkers | SPLIT_PROXY_EVENTS_WORKERS | #workers to forward events to Harness servers. |
| telemetry-workers | telemetryWorkers | SPLIT_PROXY_TELEMETRY_WORKERS | #workers to forward telemetry to Harness servers. |
| internal-metrics-rate-ms | internalTelemetryRateMs | SPLIT_PROXY_INTERNAL_METRICS_RATE_MS | How often to send internal metrics. |
| dependencies-check-rate-ms | dependenciesCheckRateMs | SPLIT_PROXY_DEPENDENCIES_CHECK_RATE_MS | How often to check dependecies health. |
Listener
The Split Proxy provides an impression listener that bulks post impressions to a user-defined HTTP endpoint.
The endpoint should expect a POST request that contains a JSON body using the following format:
{
 "impressions": [
  {
   "testName": "feature1",
   "keyImpressions": [
    {
     "keyName": "user1",
     "treatment": "on",
     "time": 1502754901182,
     "changeNumber": -1,
     "label": ""
    },
    {
     "keyName": "user2",
     "treatment": "off",
     "time": 1502754876144,
     "changeNumber": -1,
     "label": ""
    }
   ]
  }
 ],
 "sdkVersion": "php-5.2.2",
 "machineIP": "208.63.222.7",
 "MachineName": ""
}
The configuration options are available in the integrations.impressionListener section of the JSON configuration file detailed in Advanced configuration section.
Using a network proxy
If you need to use a network proxy, configure the proxies by setting the environment variables as HTTP_PROXY and HTTPS_PROXY. The internal HTTP client reads those variables and uses them to perform a server request.
$ export HTTP_PROXY="http://10.10.1.10:3128"
$ export HTTPS_PROXY="http://10.10.1.10:1080"
Admin tools
Endpoints
The split-proxy service has a set of endpoints and a dashboard that lets the DevOps and infra team monitor its status and cached data in real-time. By default, the port is 3010 and for security reason, it supports HTTP Basic Authentication configured by the user.
/info/ping
A ping endpoint to monitor the service status. If the service is running, it sends the text response pong and the HTTP status code 200.
/info/version
Returns the split-proxy version in JSON format.
{
  "version" : "1.1.0"
}
/info/uptime
Returns the uptime string representation in JSON format.
{
  "uptime" : "5d 3h 36m 39s"
}
/info/config
Returns a JSON object describing the current configuration of the proxy.
{
  "config": {
    "apikey": "*",
    "ipAddressEnabled": true,
    "initialization": {
      "timeoutMS": 10000,
      "snapshot": "",
      "forceFreshStartup": false
    },
    "server": {
      "apikeys": [
        "YOUR_SDK_KEY"
      ],
      "host": "0.0.0.0",
      "port": 3000,
      "httpCacheSize": 1000000
    },
    "admin": {
      "host": "0.0.0.0",
      "port": 3010,
      "username": "",
      "password": "",
      "secureChecks": false
    },
    "storage": {
      "volatile": {},
      "persistent": {
        "filename": ""
      }
    },
    "sync": {
      "splitRefreshRateMs": 60000,
      "segmentRefreshRateMs": 60000,
      "advanced": {
        "streamingEnabled": true,
        "httpTimeoutMs": 30000,
        "impressionsBufferSize": 500,
        "eventsBufferSize": 500,
        "telemetryBufferSize": 500,
        "impressionsWorkers": 10,
        "eventsWorkers": 10,
        "telemetryWorkers": 10,
        "internalTelemetryRateMs": 3600000
      }
    },
    "integrations": {
      "impressionListener": {
        "endpoint": "",
        "queueSize": 100
      },
      "slack": {
        "webhook": "",
        "channel": ""
      }
    },
    "logging": {
      "level": "info",
      "output": "stdout",
      "rotationMaxFiles": 10,
      "rotationMaxSizeKb": 0
    },
    "healthcheck": {
      "dependencies": {
        "dependenciesCheckRateMs": 3600000
      }
    }
  }
}
/health/application
Returns a JSON object describing whether the proxy is healthy or not.
{
  "healthy": true,
  "healthySince": "2021-11-20T19:17:23.372708-03:00",
  "items": [
    {
      "name": "Feature flags",
      "healthy": true,
      "lastHit": "2021-11-20T19:17:36.147349-03:00"
    },
    {
      "name": "Segments",
      "healthy": true,
      "lastHit": "2021-11-20T19:17:36.324172-03:00"
    }
  ]
}
/health/dependencies
Returns a JSON object describing whether the servers the proxy depends on are healthy or not.
{
  "serviceStatus": "healthy",
  "dependencies": [
    {
      "service": "https://telemetry.split.io/health",
      "healthy": true,
      "healthySince": "2021-11-20T19:17:23.372741-03:00"
    },
    {
      "service": "https://auth.split.io/health",
      "healthy": true,
      "healthySince": "2021-11-20T19:17:23.372752-03:00"
    },
    {
      "service": "https://sdk.split.io/api/version",
      "healthy": true,
      "healthySince": "2021-11-20T19:17:23.372753-03:00"
    },
    {
      "service": "https://events.split.io/api/version",
      "healthy": true,
      "healthySince": "2021-11-20T19:17:23.372755-03:00"
    },
    {
      "service": "https://streaming.split.io/health",
      "healthy": true,
      "healthySince": "2021-11-20T19:17:23.372755-03:00"
    }
  ]
}
/admin/snapshot
Returns a binary snapshot file that can be used with the snapshot environment variable or command line argument when starting up the Split Proxy.
Admin Dashboard
Split Proxy has a web admin user interface out of the box that exposes all available endpoints. Browse to /admin/dashboard to see it.
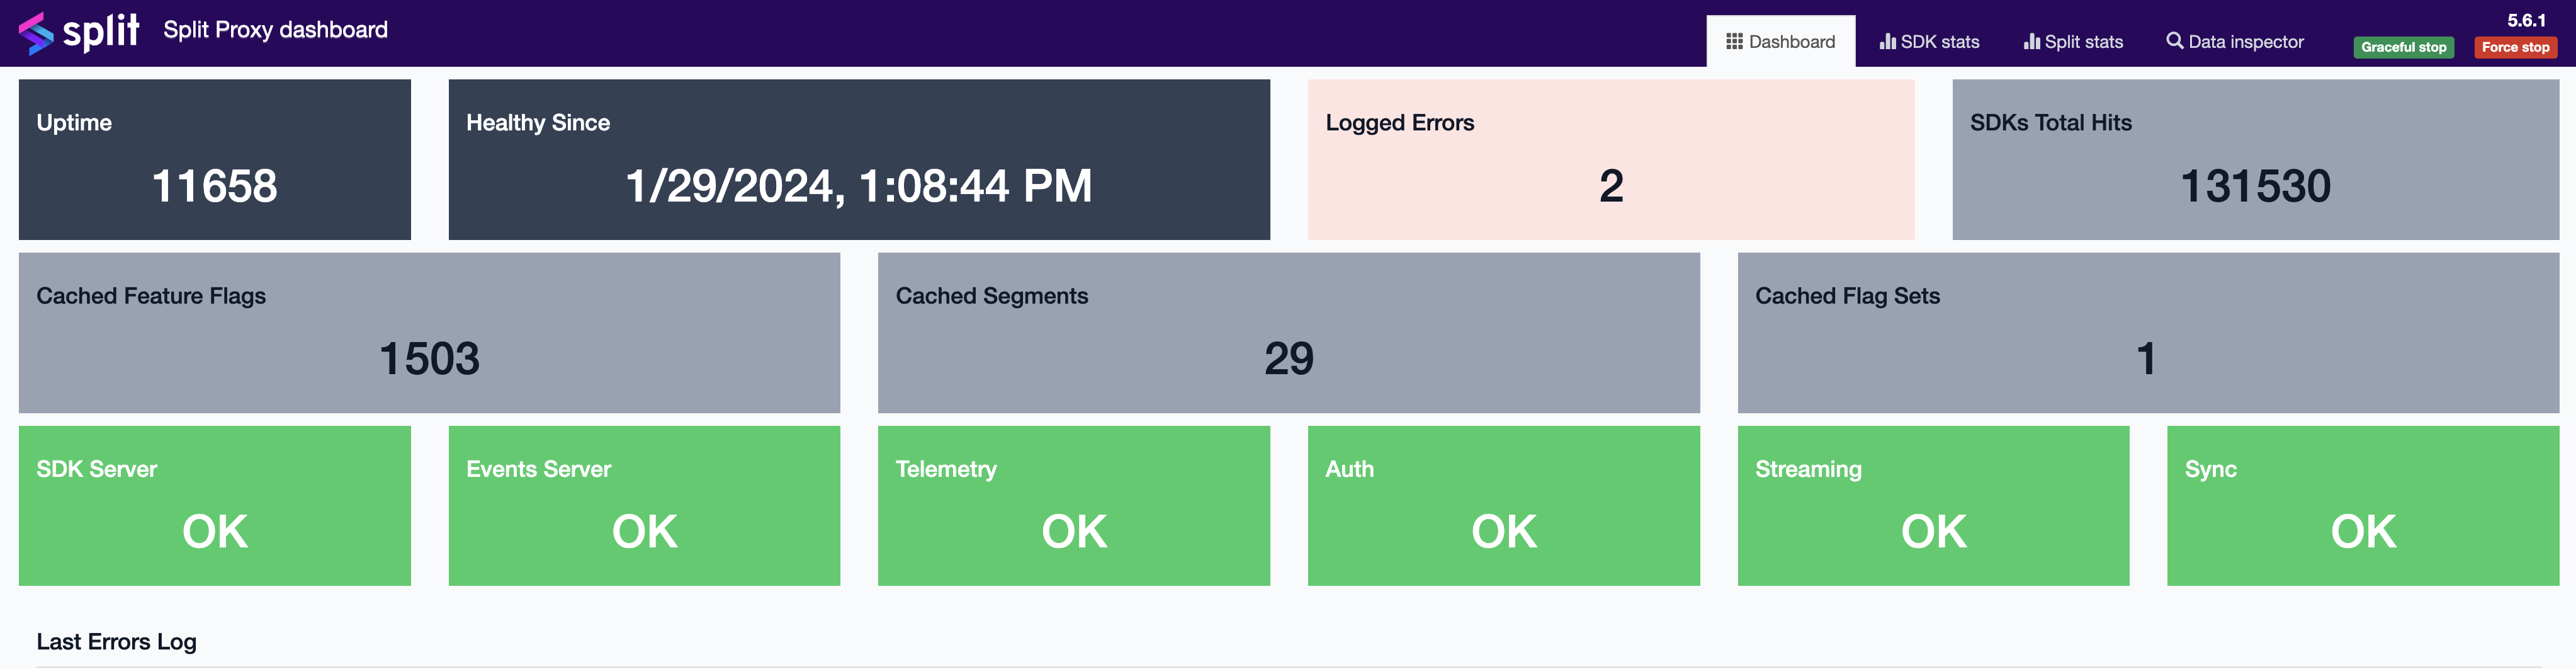
The dashboard is organized into four sections for easy visualization:
- Dashboard: Tile-sorted summary information, including these metrics:
- Uptime: Uptime metric
- Healthy Since: Time passed without errors
- Logged Errors: Total count of error messages
- SDKs Total Hits: Total SDKs requests
- Backend Total Hits: Total backend requests between split-proxy and Harness servers
- Cached Feature flags: Number of feature flags cached in memory
- Cached Segments: Number of segments cached in memory
- SDK Server: displays the status of server for SDK
- Events Server: displays the status of server for Events
- Streaming Server: displays the status of streaming service
- Auth Server: displays the status of server for initial streaming authentication
- Telemetry Server: displays the status of server for telemetry capturing
- Storage: (only Sync mode) displays the status of the storage
- Sync: displays the status of the Proxy
- Last Errors Log: List of the last 10 error messages
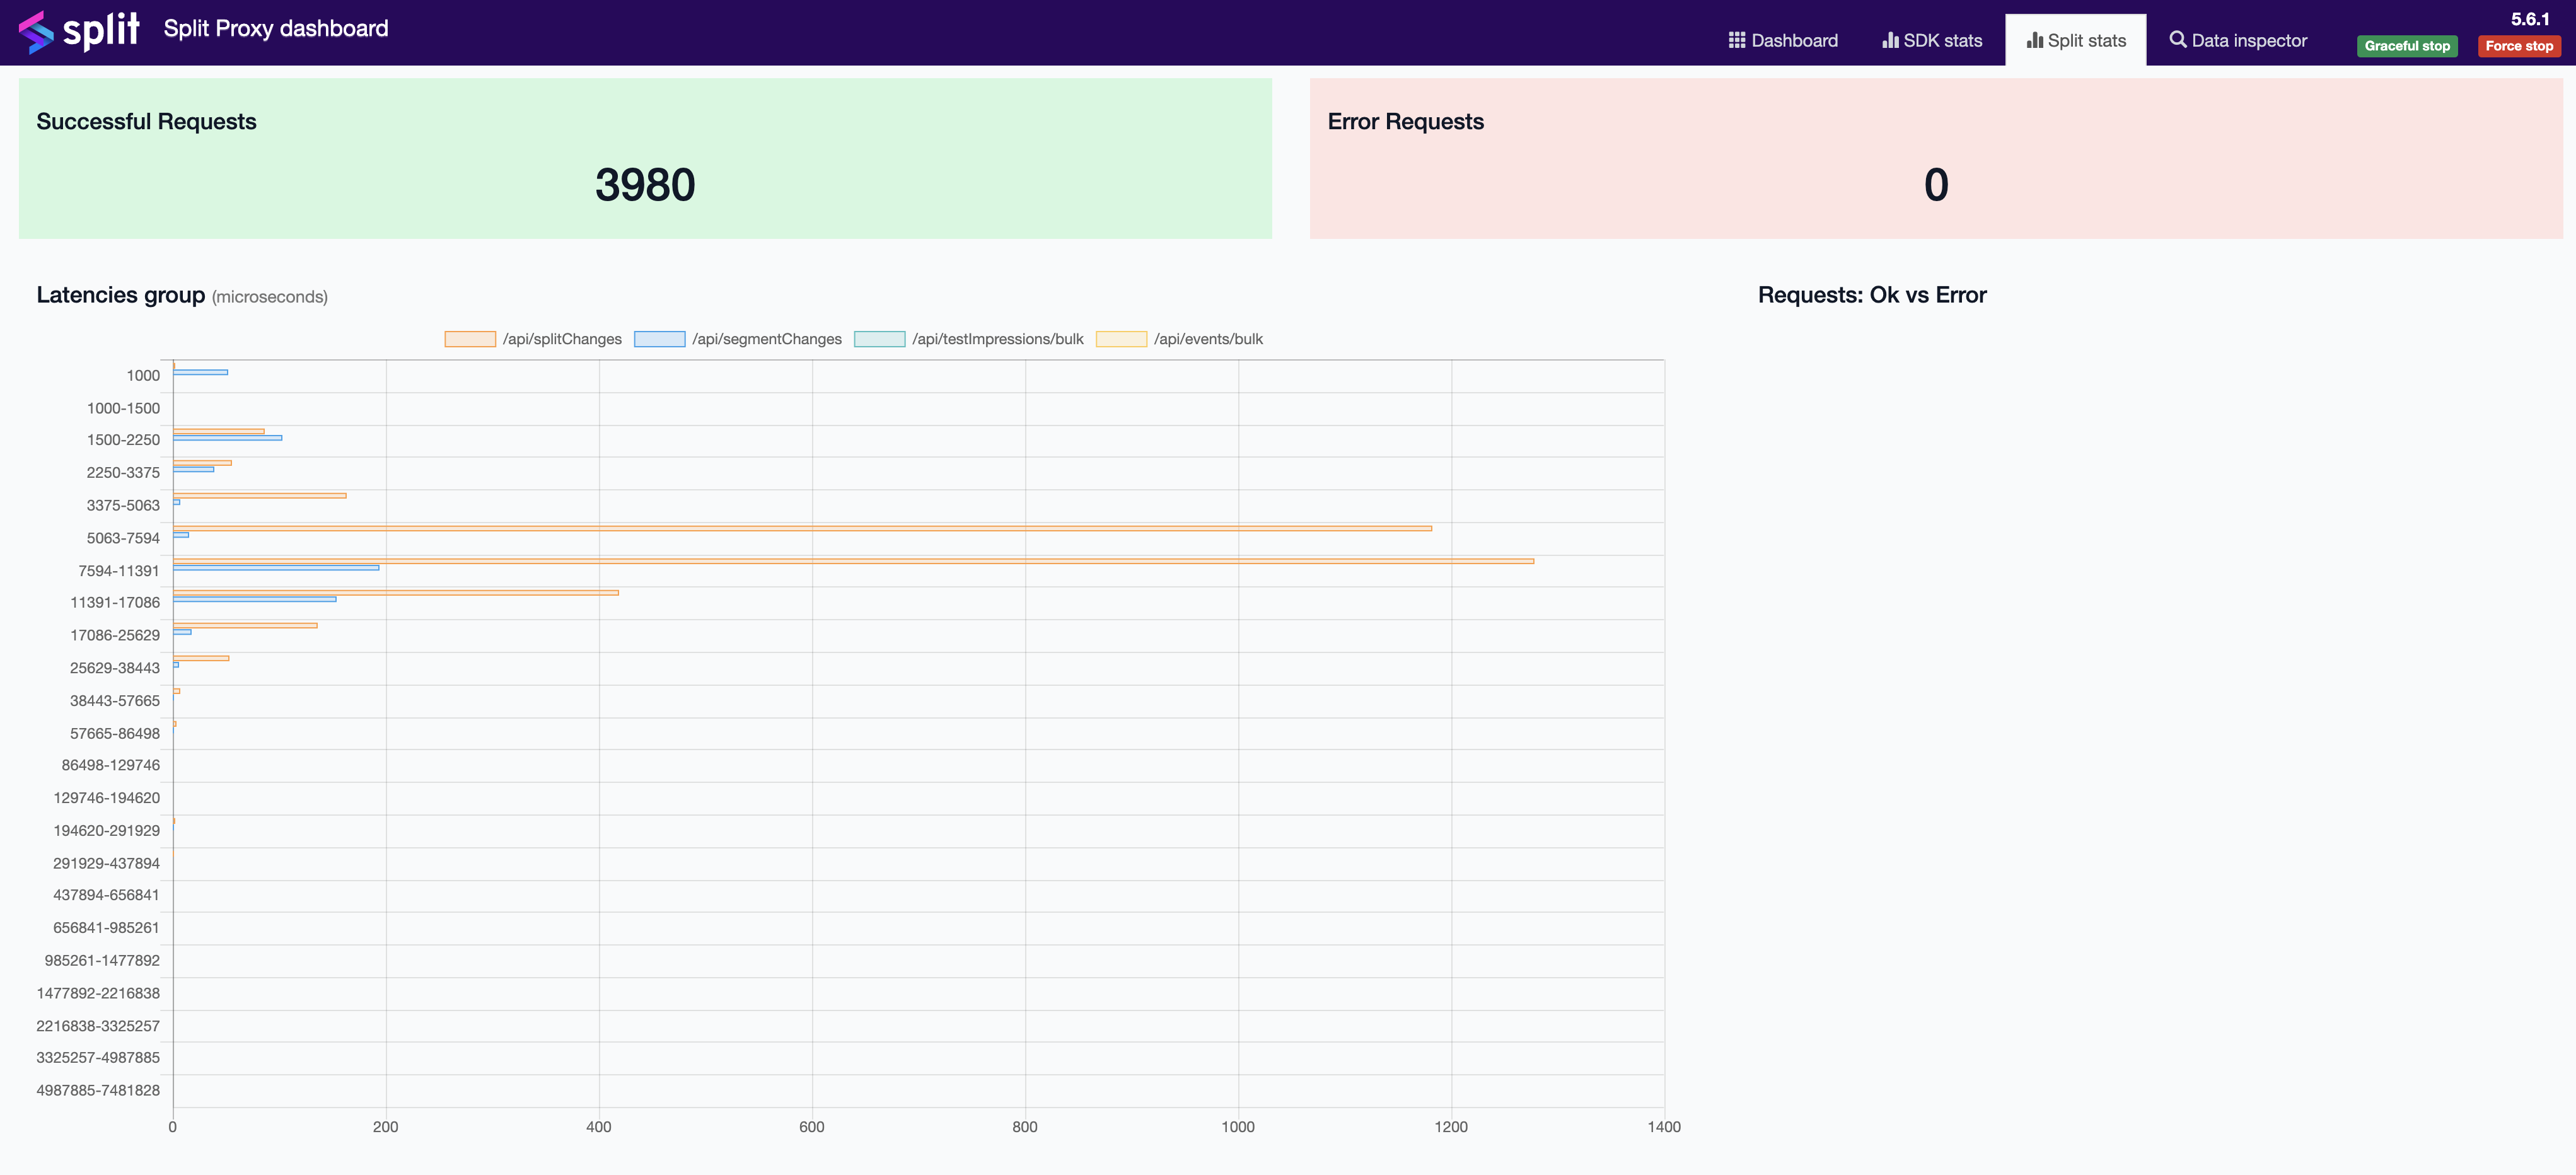
- SDK stats: Metrics numbers and a latency graph, measured between SDKs requests integration and proxy
- Split stats: Metrics numbers and a latency graph, measured between proxy requests integration with Harness servers
- Data inspector: Cached data showing feature flags and segments; filters to find keys and feature flag definitions
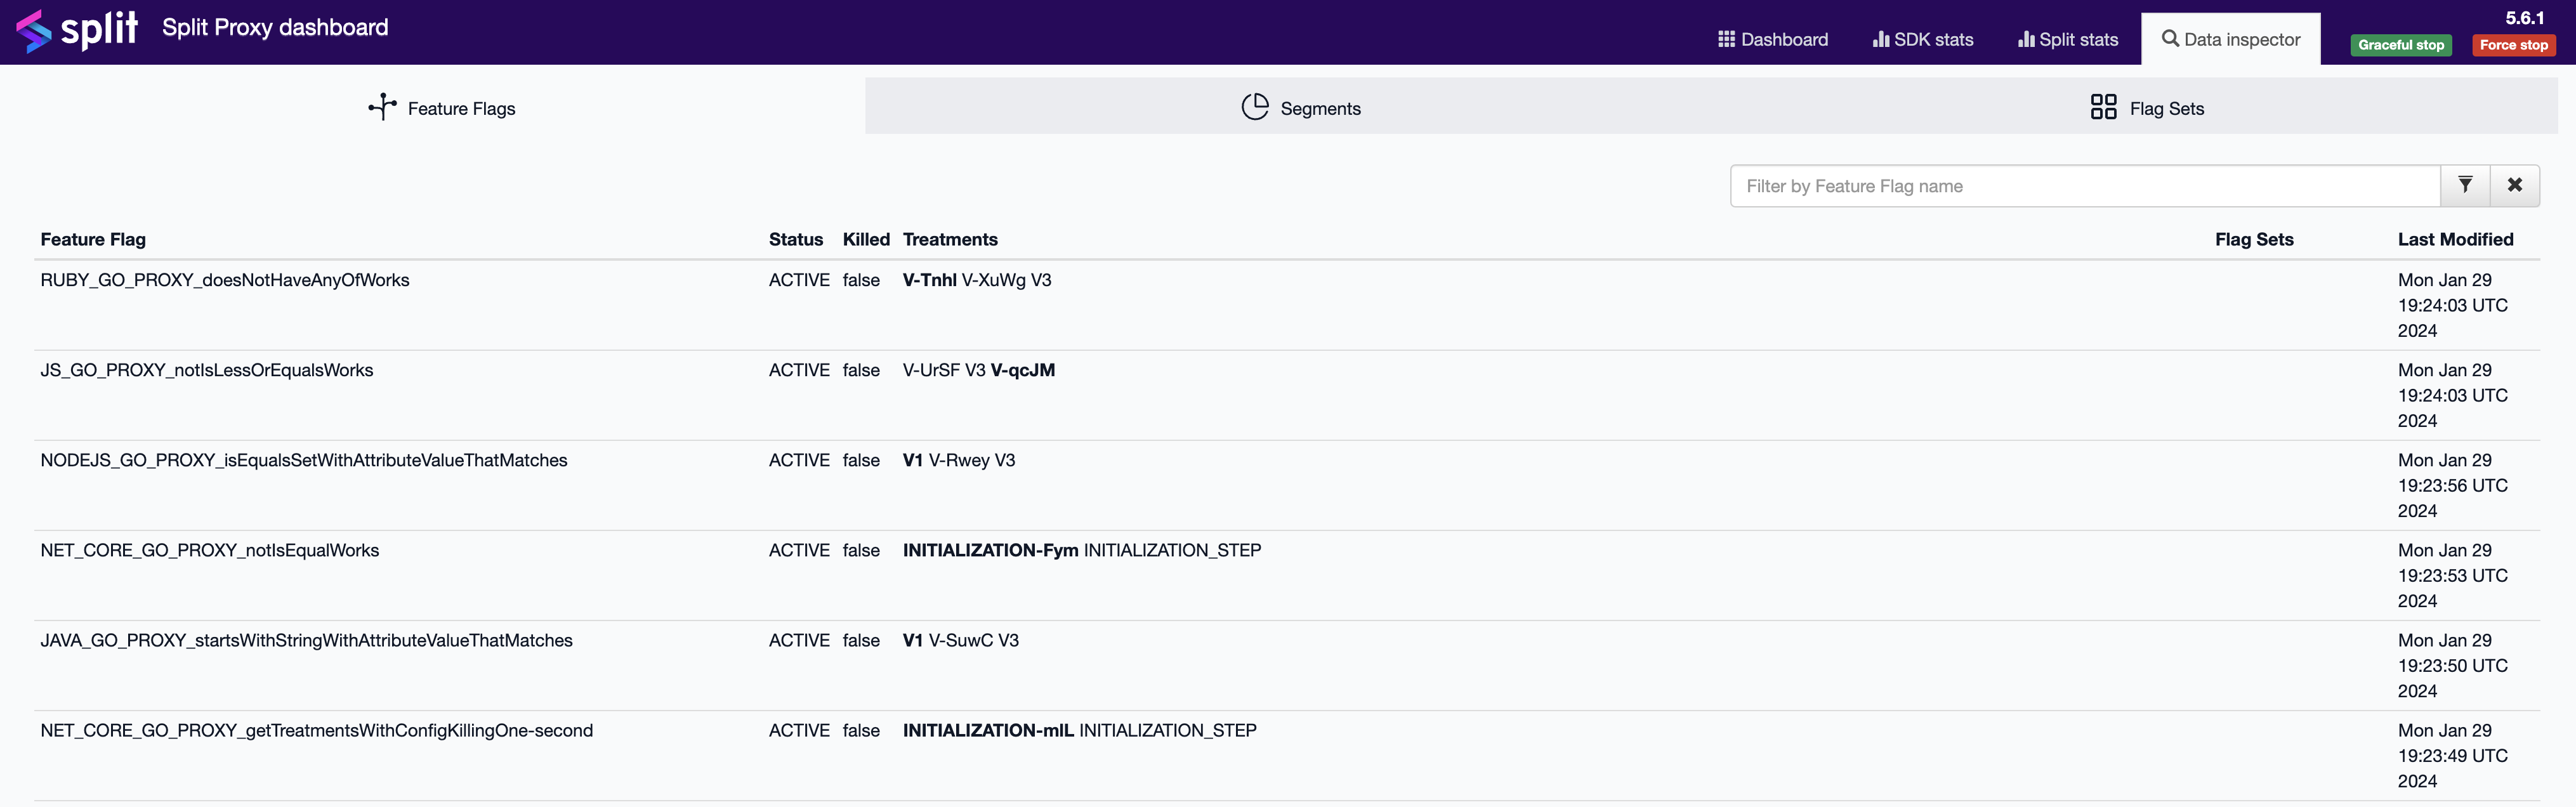
The dashboard numbers are committed every 60 seconds. The Logged Errors, Last Errors Log tiles, and Data inspector section are populated each time the dashboard is refreshed.
For Impressions and Events Queue size, the numbers are refreshed every 10 seconds.
Service shutdown
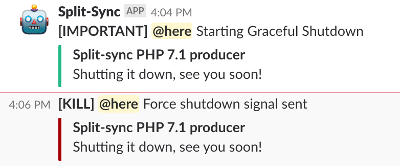
The split-proxy service can catch a kill sig command and start a graceful shutdown, flushing all cached data progressively. Additionally, you can perform graceful stop and force stop (kill -9) with one click from the admin dashboard.

If you configure a Slack channel and a Slack Webhook URL, an alert is sent to the channel when an initialization or shutdown is performed.